Monday, March 5, 2007

A True Metrics: Running Tested Features (RTF)

Ron Jeffries, one of the founding fathers of Agile wrote an excellent summary of what he considers a truly valuable metric, RTF or Running Tested Features. You can view the article here.

From the article:

What is the Point of the Project?

I'm just guessing, but I think the point of most software development projects is software that works, and that has the most features possible per dollar of investment. I call that notion Running Tested [Features], and in fact it can be measured, to a degree.

Imagine the following definition of RTF:

  1. The desired software is broken down into named features (requirements, stories) which are part of what it means to deliver the desired system.
  2. For each named feature, there are one or more automated acceptance tests which, when they work, will show that the feature in question is implemented.
  3. The RTF metric shows, at every moment in the project, how many features are passing all their acceptance tests.
How many customer-defined features are known, through independently-defined testing, to be working? Now there's a metric I could live with.

Thursday, February 22, 2007

5 Essentials for Software Development Metrics

I ran across a whitepaper today by 6th Sense Analytics that summarizes the essentials of a software development metrics program. The paper doesn't specify the metrics to collect, just the properties they should all have. An overview is provided below. You can find the full whitepaper here.

From my perspective, for any metric to be useful, it needs to help the Project Manager make decisions. As this whitepaper states, all metrics should be actionable. If it's not actionable, then it's not useful.

Introduction
Today's approach to metrics calls for automation over process and in-process adjustments over post-mortem analysis. Information should be made available to all stakeholders throughout the lifecycle.

To be effective, metrics must be properly planned, managed and acted upon. What is measured, how it’s collected and how it’s interpreted are the difference between brilliant insights and blind alleys on the path to metrics-driven software development.

The key is to ensure metrics are meaningful, up-to-date, unobtrusive, empirical and actionable.

#1 - MEANINGFUL
Emerging activity-based software development metrics solutions focus on a simple and fundamental unit of measure: Active Time. Understanding the actual time being applied to these activities across a portfolio of systems and projects can provide an important level of insight that enables organizations to understand project velocity, relative investment, sequencing of activities, and opportunities and risks. It also provides a uniform basis for comparison across projects and teams.

Select metrics that will enable you to steer your projects in a meaningful way.

#2 - UP-TO-DATE
It is important to look for metrics that can be captured automatically during the execution of the process itself. Activity-based metrics solutions are able to automatically capture metrics during the conduct of the software development process, ensuring that the metric is consistently based on up-to-date data.

#3 - UNOBTRUSIVE
The process of collecting data for your metrics program should be seamless and unobtrusive, not imposing new processes or asking developers to spend time collecting or reporting on data.


#4 - EMPIRICAL
Activity-based metrics solutions capture data as software development processes are executed, eliminating all of the issues that compromise the integrity and accuracy of data. Additionally, the use of the Active Time metric ensures data consistency; an Active Hour is the same in Boston, Bangalore, Mumbai and Beijing.

#5 - ACTIONABLE
It is critical that the metrics you gather inform specific decisions during the course of your software development projects. Avoid information that is nice to know, but doesn’t help you make decisions or solve problems.

The litmus test for any metric is asking the question, “What decision or decisions does this metric inform?” Be sure you select your metrics based on a clear understanding of how actionable they are and be sure they are tied to a question you feel strongly you need to answer to effect the outcome of your software development projects.

It is also critically important to ensure that you are able to act on and react to metrics during the course of a project.

Finally, be sure that metrics programs are inclusive and that data is available to all stakeholders within the software development lifecycle. Data that is widely available is empowering.

Standard Progress Reporting & Tracking

A simply way to improve visibility for customers into projects is through reporting and metrics.

Timeline
The first thing that all stakeholders want to know is how does the timeline look. Are we on track? Are there any delays? What is our next milestone? I create a simple timeline in Excel (you can use Visio if you prefer) and color code it to indicate the health of each iteration.


Parking Lot
Provide visibility into the progress of features of the system. Use the same color coding system as the timeline. Each feature has a number of UCs associated with it and you can show the percentage of those UCs that have been delivered to the client.


Productivity
Report the team's productivity after each iteration. Also show the target for the team. I report function points per hour because I want to see the productivity going up.


Resource Burn Rate
Our customers need to know how many resources we have any our burn rate. They have budgets they need to manage too. In this example, I am only reporting past periods, but it could easily be extended to any future timeframe. I build this from the Ramp Plan. I also report the resource count (onshore and offshore) by role.


Burndown & Burnup

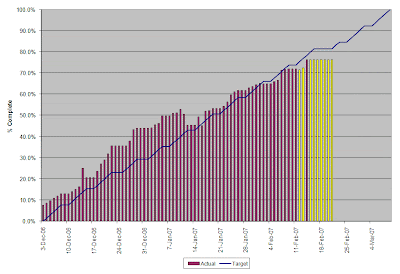
Use a burndown chart to track the remaining effort against plan. Use a burnup to track the % complete against plan. I color code the bars to indicate where we went off track. I also add call outs to explain large changes. I report the data in a small table (e.g., planned effort, actual effort remaining, difference).


Testing

There are several reports that you can create to provide visibility into testing. This example represents our defect trend by severity over the course of an iteration.


Attrition Rate
Most of our clients are concerned about turnover and losing key resources. We have introduced the following graphs to track our attrition rate per quarter. We also list the resources that left and the reasons for leaving.


Other Metrics Under Consideration

  • Planned vs. actual features delivered by iteration
  • Velocity (# of FPs delivered by iteration)
  • Defect discovery rate
  • Defect density (defects per FP)

Thursday, January 25, 2007

Scrum vs. RUP - The winner is...

...the Team!!!!

Back in August, I talked about how agile was working with my offshore team. Over the past few months we've had our ups and downs, but the good thing is that we've learned from our mistakes and continued to modify the process to fit our project's needs. All those iteration assessments (or lessons learned or retrospectives) that we conduct really pay off if you take the time to adjust based on what you learn.

Overall, we've ended up modifying our strictly RUP process to accomodate for some of the Scrum methodologies that we are comfortable with as an organization. Here is an update:

Potentially Releasable Software
  • The team was having difficulty with this concept
  • The team was killing themselves trying to get the defect counts within the acceptance criteria
  • We came up with a compromise that is working well.
    (1) Iterations are now about 3 months long versus 5 weeks
    (2) We deliver an "in progress" build to the customer at the end of each month to get early feedback; this build always includes UCs that have been completed during that month and other in progress UCs.
    (3) We commit to meeting the quality criteria by the end of the iteration
Product Backlog
  • We've altered the Product Backlog to be a combined Release Roadmap and Release Planning document
  • It serves the same purpose, however it has made planning easier since we have added more columns to track builds, effort per build, contingencies, rework, etc.
Planning
  • This was the biggest problem area and the area where we've seen the most improvement. It's amazing how good planning improves morale!
  • We now have one master Iteration Backlog for the team as a whole.
  • Each of the teams manages their own Project Plan and these roll up into a Master Project Plan.
  • From the Master Project Plan I can get the progress of the build and the progress of the iteration.
  • We are using both burndown and burnup charts. This makes is very easy to see the progress and gives the customer visibility into the project.
  • On the burndown charts, I track the remaining effort against the target.
  • On the burnup charts, I track the percent complete against the target.
  • The actual data that generates these charts changes to red if something is behind.
Sample Iteration and Build Burndowns


Sample Iteration and Build Burnups